
As we continue to build more functionality and explore innovative ways to deliver actionable insights through data visualizations, equal focus must also be placed in optimizing for load and efficiency. This covers a range of different steps we can take, from data preparation, design and performance tuning.
⌛ So what’s an acceptable load time?
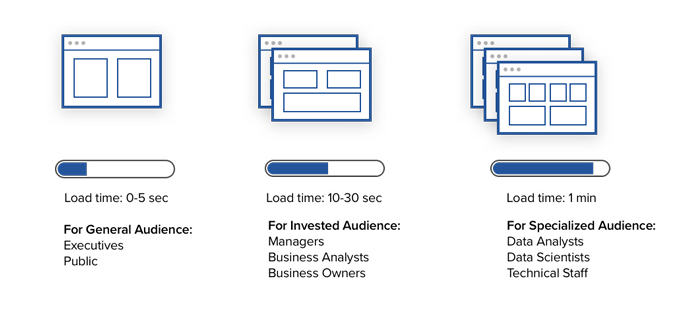
A Tableau dashboard is consumed the same way we consume digital experiences on the web and the ideal load time for a webpage is between 0-5 seconds. In addition, response time for dashboard interactivity (filters, navigation, download, etc) should take a similar approach.
🔎 How to identify chokepoints
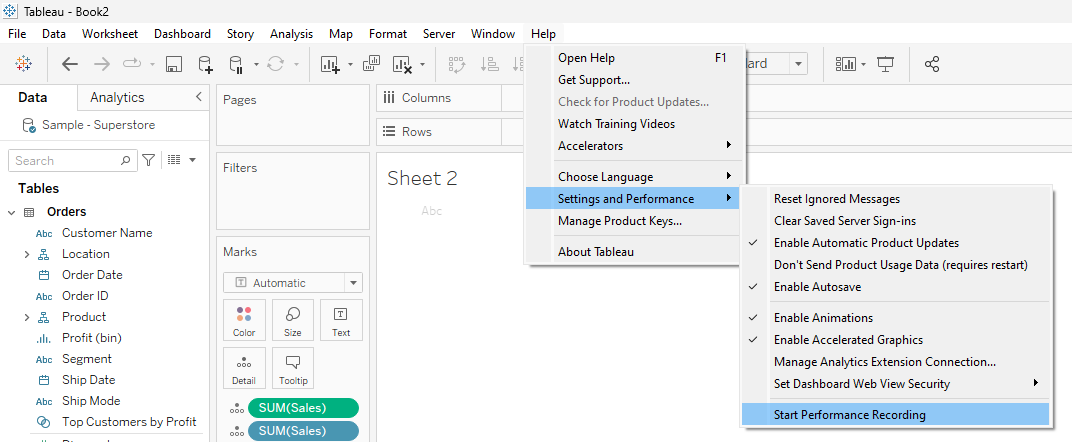
1. Open a fresh instance of Tableau and select Start Performance Recording in the Help > Settings and Performance menu.
2. Open the dashboard you want to assess and let it load completely.
3. Wait 30 secs to 1 minute, and make a change such as:
- Navigate to another dashboard page
- Change a filter or parameter
- Go to a specific worksheet
4. Repeat Step 3 until you have everything you need to test
5. Go back to the Help > Settings and Performance > Stop Performance Recording and wait until Tableau opens a new workbook with the performance details
🔮 How to read the output
The dashboard comes in three views:
- Timeline - Shows the chronological sequence of all events that occurred
- Events - Colors indicate different types of events
- Query - Shows the actual SQL connection or XML (if you are connecting to published sources)
Understanding the event types
- Computing layouts
- If layouts are taking too long, consider simplifying your workbook.
- Connecting to data source
- Slow connections could be due to network issues or issues with the database server.
- Compiling query
- This event captures the amount of time spent by Tableau in generating the queries. Long compile query times indicate that the queries generated are complex. The complexity may be due to too many filters, complex calculations, or generally due to a complex workbook. Examples of complex calculations include, lengthy calculations, LOD calculations, or nested calculations. Try simplifying the workbook, using action filters or moving calculations to the underlying database.
- Executing query
- For live connections, if queries are taking too long, it could be because the underlying data structure isn’t optimized for Tableau. Consult your database server’s documentation. As an alternative, consider using an extract to speed performance.
- For extracts, if queries are taking too long, review your use of filters. If you have a lot of filters, would a context filter make more sense? If you have a dashboard that uses filters, consider using action filters, which can help with performance.
- Generating extract
- To speed up extract generation, consider only importing some data from the original data source. For example, you can filter on specific data fields, or create a sample based on a specified number of rows or percentage of the data.
- Geocoding
- To speed up geocoding performance, try using less data or filtering out data.
- Blending data
- To speed up data blending, try using less data or filtering out data.
- Server rendering
- You can speed up server rendering by running additional VizQL Server processes on additional machines.
⏩ How can we optimize for that?
Check out Tableau’s whitepaper on Designing Efficient Workbooks as well.
📒 Optimizing Data Sources
- Extract instead of Live connections
- Extracts are optimized for Tableau’s hyper query engine, which can significantly improve performance.
- For frequently updated data, use incremental extracts to keep the extract file size manageable.
- Beginning with version 2024.2, Tableau has introduced a new feature that enables users to specify a specific time range for refreshing data from the source. Users can opt for incremental refresh when configuring an extract and set a minimum date range for the refresh. For instance, they can choose to refresh data from the last 14 days starting from the refresh date. This functionality is useful for data sources that allow for inserts and retroactive modifications within a defined time period, ensuring that any changes and new data are captured during the incremental extract refresh.
- Beginning with version 2024.2, Tableau has introduced a new feature that enables users to specify a specific time range for refreshing data from the source. Users can opt for incremental refresh when configuring an extract and set a minimum date range for the refresh. For instance, they can choose to refresh data from the last 14 days starting from the refresh date. This functionality is useful for data sources that allow for inserts and retroactive modifications within a defined time period, ensuring that any changes and new data are captured during the incremental extract refresh.
- Filter Data at Data source level
- Custom SQL can help to limit the scope and amount of data being pulled in
- Custom SQL can help to limit the scope and amount of data being pulled in
- Tall instead of Wide tables are preferred as it can take advantage of the Hyper engine.
- Issues have been found in previous MA releases with tables > 100 columns.
- Issues have been found in previous MA releases with tables > 100 columns.
- Hide unused fields
- Fields that are not used in any visualization or calculation should be hidden to reduce the data volume as they are still loaded upon dashboard load.
- Fields that are not used in any visualization or calculation should be hidden to reduce the data volume as they are still loaded upon dashboard load.
- Leverage on Tableau’s relational model in the Logical layer instead of joining in the Physical layer.
- Row-level security prevents Tableau to do any caching and should be used with caution.
- Data blending should be avoided as much as possible as it is a row-level joins and take place at the lowest order of all calculations.
👨🔬Optimizing Calculations
- 🟩 Low processing Power
- Basic aggregation functions that aggregate data, such as SUM, AVG, MIN, MAX, and COUNT. These calculations are typically processed quickly, especially if the data source supports them natively.
- Calculations that operate on each row of data, like arithmetic operations or string manipulations, are relatively efficient but can become inefficient as data volume grows.
- 🟨 Use with caution
- Table calculations such as WINDOW_SUM, RANK and RUNNING_AVG are computed on the data that has already been aggregated in the view, which can be resource-intensive depending on the complexity and the size of the dataset.
- Level of Detail (LOD) Expressions are often resource intensive because they are nested sub-select statements and take place after everything in the view is computed.
- 🟥 Avoid if you can
- COUNTD is slow as there’s multiple loops Tableau does to retrieve distinct values.
- Calculations that involve blending data from multiple data sources requires Tableau to join data on the fly (similar to a Live connection), which can be very slow especially with huge/complex datasets.
- String functions (LEFT, MID, etc) and Regular Expressions (REGEXP_REPLACE, etc) that manipulate string data are very slow as they scan every character in the string of every data row.
- Complex nested calculations that involve multiple nested levels of calculations or a combination of different types of calculation are the most demanding because they require multiple passes over the data, and each additional nested level adds to the computational complexity. Example below:
IF SUM([Sales]) > WINDOW_AVG(SUM([Sales])) THEN 'Above' ELSE 'Below' END
⚠️ Use these alternatives for faster processing
- MIN/MAX are faster than ATTR/AVG because the latter calculates the MIN/MAX prior, so essentially you’re saving half the time.
- Make groups with CASE statements instead of using the native group functionality. The latter loads the entire dataset before aggregating them into groups. Performance efficiency from best to worst:
- CASE statements
- Tableau Sets
- Tableau Groups
- IF / ELSE IF / ELSE statements
- Use IN instead of OR statements as the latter forces Tableau to evaluate each condition separately.
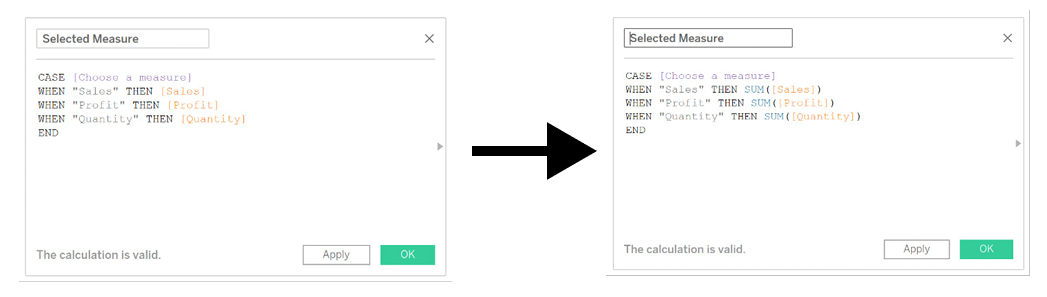
- Use aggregated values in nested calculations instead of row-level values to force Tableau to return as little data rows as possible:
🎨 Optimizing Design
- Limit the number of visualizations in a page
- Each visualization requires a separate query to the data source. Fewer visualizations mean fewer queries and faster load times.
- Combine multiple visualizations into a single, more informative view.
- Use Parameter-Based Swapping and allow users to switch between different views instead of using a complex single visualization.
- Make use of Dynamic Zone Visibility to reduce the complexity of the page, but do note that while Tableau utilizes “lazy-loading” which doesn’t render the hidden sheets, any shared filters/parameters are still processed together with visible worksheets.
- Tableau uses the Document Object Model when loading dashboards, which means it reads all the XML information before any data processing takes place. Additional file size can be incurred through:
- Number of Images
- Device-specific dashboards
- Numbers of objects
- Number of dashboards
- Number of queries
- … and more
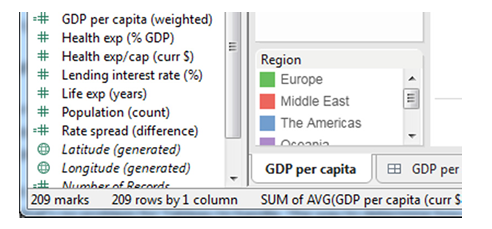
- Ensure a low mark count on your visualization. Check the bottom left corner of the canvas.
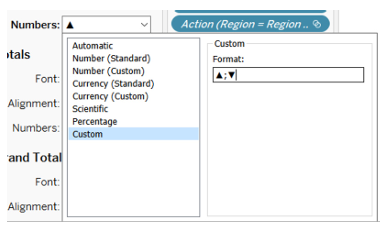
- Use text formatting instead of calculations and shapes
- Use transparent background PNGs instead of JPGs as they have less file size footprint.
- Avoid using “Only relevant values” in quick filters as Tableau does a double query to populate that list.
- Context Filters should be not be used as quick filters as it’s ranked #2 after data source filters.
- As Tableau loads all values into the quick filter, do consider the cardinality of it:
- 🟥 High-cardinality: These columns have values that have very rare values or are unique. An example of high-cardinality column values might be unique identifiers or email addresses.
- 🟧 Normal-cardinality: The normal category has values that are somewhat uncommon. An example might be customer last names. There are some names that are common, such as “Jones,” but there would be values that are very uncommon, such as “Jahanshahi.”
- 🟩 Low-cardinality: These refer to column values that have very few unique values. Some examples would include Boolean values or major classifications such as gender.
- Include filters work faster than Exclude filters as the latter loads the entire domain of a dimension.
- Limit the number of filters in the view. Recommended 0-3 quick filters.
- Continuous date filers can take advantage of indexing properties and is faster than discrete dates.
This is not an exhaustive list of how you can optimize your dashboards, nor it is a MUST-DO but it should give you a good foundational understanding of Tableau's under the hood. The Performance Recorder is a very much under-utilized feature, so hopefully this gives you some idea of how to implement that. You can always reach out for me on LinkedIn or X/Twitter if you need help, or if you have tips to share with everyone. Til then, keep vizzing 😎